Overview
This page summarizes and compares multiple years of our annual Form 990 filings to illustrate income and expenses over time.
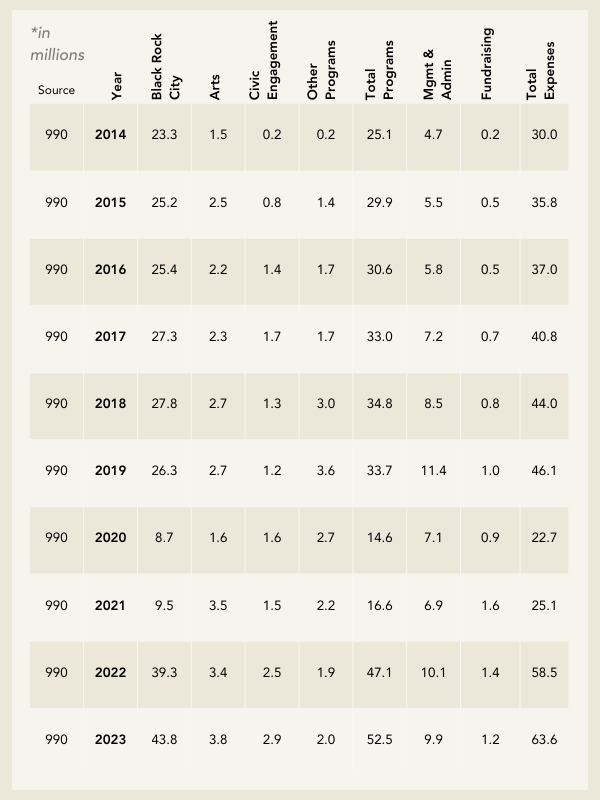
The table below summarizes the information from Burning Man Project’s 990s from the last 10 years, indicating the uses of our cash — also known as expenses. Below this chart is an explanation of the breakout of areas.
990 Total Expenses Chart
- Black Rock City includes direct costs such as toilets, government fees, medical, staff, heavy equipment, fuel, communications (internet, radios, etc), Black Rock Station production facility, auto shop, vendors (ice, staff commissary), and road watering. (partial list)
- Burning Man Arts are direct costs of art grants (including Temple), and staff
- Civic Engagement is the combined support of Burners Without Borders and the Regional Network including staff and grants.
- Other Programs includes support for Fly Ranch and the Education and Philosophical Center programs all intrinsically linked with the success of Black Rock City.
- Management and Administrative costs include information technology (IT), accounting, and people operations (HR). These costs are more than 80% related to Black Rock City.
- Fundraising is the expenses incurred in support of fundraising efforts.
The above table information is presented below in graphical format:
As is the case for many organizations, the primary driver in costs is labor. Starting in 2018, we recalibrated pay at all levels to meet industry standards for a non profit of our size. This helps us maintain the ability and caliber of the workforce to develop a process and programs that bring the Burning Man culture to life.
Our overall expenses have grown more than double in the last 10 years; however direct costs related to Black Rock City had a significant jump after the COVID-19 pandemic. Primary operational expenditures are related to supporting Black Rock City and have been for the last 10 years.
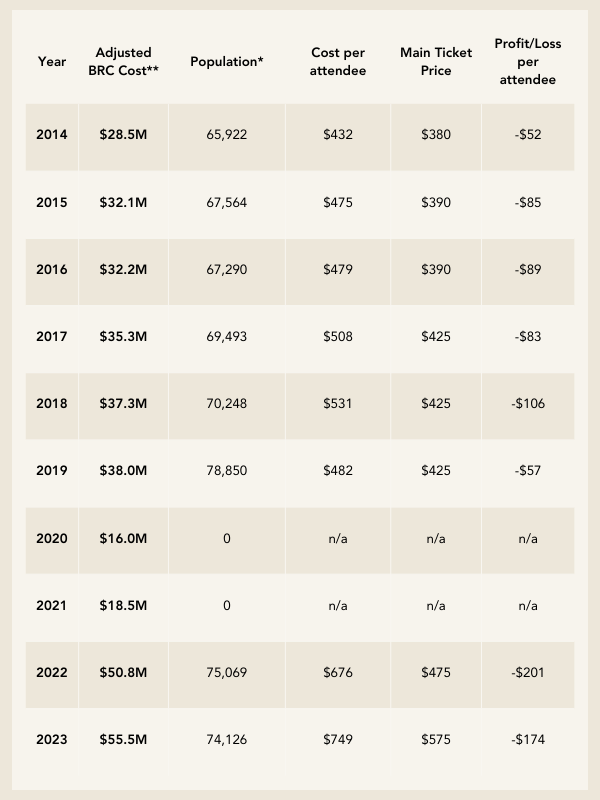
Cost of Black Rock City per Attendee
990 Cost of Black Rock City per Attendee Chart
* Population as indicated on the Burning Man timeline website and submitted and agreed upon with the Bureau of Land Management
** Adjusted cost of BRC includes the cost of Black Rock City and the Arts program, as well as 80% of the time in Management and Administration, which is primarily composed of Information Technology, Accounting, and People Operations where the efforts are approximately 80% of the time focused on supporting Black Rock City.
- Cost per Attendee is Adjusted BRC cost divided by population.
- Main Ticket Price is the cost of a main sale ticket price.
- Profit / Loss per Attendee is the difference between the Cost Per Attendee and Main Ticket Price.
By comparing the BRC cost (as adjusted) divided by the population for each of the years to the main sale ticket price, it’s evident that since 2014, tickets have been subsidized to keep Black Rock City accessible to as many people as possible. In 2016, with the da Vinci’s Workshop theme, we amplified the higher priced tickets as a way to mirror the desire for patronage and support of the nonprofit and offsetting ticket prices. Over time, that underwriting of costs is not enough to maintain an accessible event and advance the global culture.
Revenue
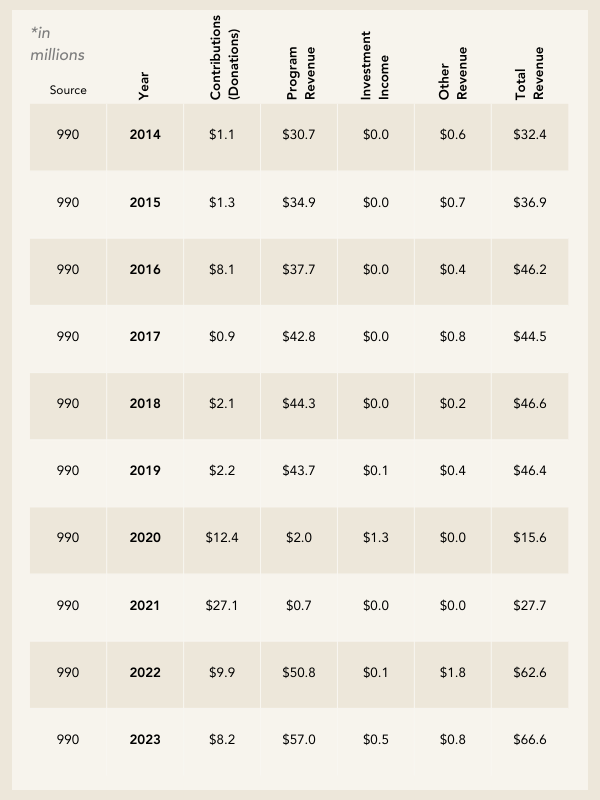
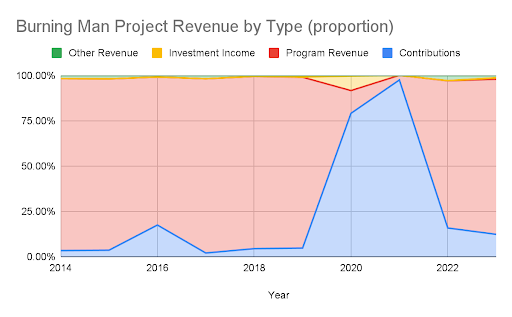
The table below summarizes the information from the 990’s from the last 10 years, indicating the sources of revenue. Below this chart is an explanation of the breakout of areas.
990 Revenue Chart
- Contributions (Donations) are charitable donations.
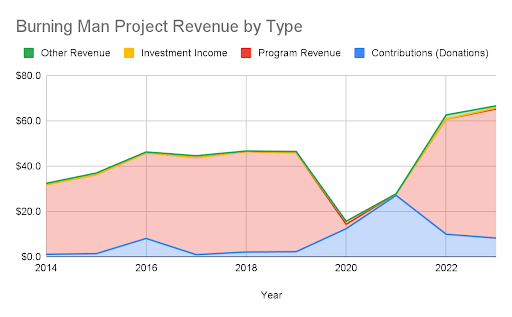
- Program Revenue is primarily (nearly all) the ticket revenue from Black Rock City. This is clearly our largest revenue stream, except of course for the two years during the COVID-19 pandemic.
- Investment Income is interest income we have secured from cash management.
- Other Revenue is various small revenue streams.
The above table information is presented below in graphical format:
Fixed Assets
Fixed assets are multi-year investments typically in the form of vehicles, buildings, land, or significant improvements that require “capitalization” from an accounting and tax perspective, which means it is included as an asset. On an ongoing basis, these types of assets require maintenance and capital development.
990 Fixed Assets Chart

- Fixed Assets Beginning Balance is the beginning of the year balance of fixed assets.
- Fixed Assets Ending Balance is the ending of the year balance of fixed assets.
- Fixed Assets Changes During the Year is the difference between beginning and ending. This shows the additions of fixed assets (offset by depreciation, which is the over-time expense of fixed assets).
What does this Fixed Asset chart all mean:
- In 2014, we purchased Black Rock Station, which is the storage ranch for infrastructure and vehicles for Black Rock City, as well as other properties in Gerlach which are used to support the Black Rock City build, and tear-down operations.
- In 2016 we purchased Fly Ranch exclusively with contributions (donations) raised for that acquisition.
- Other fixed assets include The 360, other smaller properties, vehicles and staff housing that all are in support of BRC. See here for more details.
- Income generated from operations (Revenue less Expenses) has been invested in fixed assets.
Cash
The table below is our year-end cash balance from 2014 onwards, as reported on the form 990. Due to the cyclical nature of the ticket sales (spring) and fundraising (late fall/winter), cash management requires careful timing considerations.
990 Cash Chart
| Source | Year | Cash (in millions) |
| 990 | 2014 | $6 |
| 990 | 2015 | $7 |
| 990 | 2016 | $9 |
| 990 | 2017 | $11 |
| 990 | 2018 | $14 |
| 990 | 2019 | $16 |
| 990 | 2020 | $11 |
| 990 | 2021 | $15 |
| 990 | 2022 | $17 |
| 990 | 2023 | $9 |


